All Courses

This comprehensive course is designed to provide you with a solid foundation in the exciting world of foreign exchange (forex) trading. Whether you're an aspiring trader seeking to enter the financial markets or a seasoned investor looking to diversify your portfolio, this course will equip you with the essential knowledge and skills to understand and navigate the forex market effectively.
By the end of this course, you will have a solid understanding of the foundations of forex market trading. Armed with this knowledge, you'll be ready to embark on your forex trading journey with confidence and a solid foundation for further advanced studies in the field. Let's begin the exciting journey of Forex Trading 101!

In this course we will going to introduce you to different types of forex trading analysis used by individual and institutional traders. We will also be diving into chart using the most sophisticated and advance trading software today which is the Metatrader 5, we will discuss its functionality and how you can have an advantage in using them.

This course provides a comprehensive introduction to frequency distributions and graphical representations of data. Students will learn how to organize data into frequency tables and interpret various types of graphs such as histograms, bar charts, pie charts, and frequency polygons. Key topics include:
- Constructing and interpreting frequency tables
- Understanding and creating different types of graphs
- Analyzing and interpreting graphical data
- Identifying patterns and trends in data
By the end of the course, students will be proficient in presenting data visually to facilitate better understanding and decision-making.

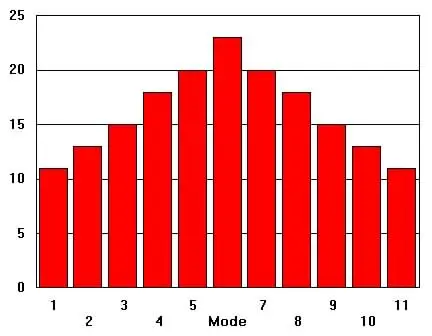
The presentation starts with an introduction to the concept of central tendencies in statistics, which are measures used to determine the center or typical value of a dataset. It begins by discussing the mean, explaining how it is calculated by summing all data points and dividing by the number of points. The median is then covered, defined as the middle value when the data is ordered from smallest to largest, and its significance in representing the central value in skewed distributions is highlighted. The mode, which is the most frequently occurring value in a dataset, is also explained, along with its use in identifying the most common data points. The presentation includes examples and visual aids to illustrate each measure, their calculation, and their appropriate applications. Finally, a comparison of these measures is provided, discussing their strengths and weaknesses, and offering guidance on choosing the right measure based on the nature of the data and the analysis objectives.

Measures of dispersion and location are crucial for understanding the spread and positioning of data within a dataset. Measures of dispersion provide insights into the variability or spread of the data, helping to assess how much the values differ from the central tendency. Common measures include the range, which is the difference between the maximum and minimum values; the variance, which quantifies the average squared deviation from the mean; and the standard deviation, which is the square root of the variance and represents average deviation from the mean in the same units as the data. Additionally, the interquartile range (IQR) measures the spread of the middle 50% of the data by subtracting the first quartile from the third quartile, providing a robust measure of variability.
Measures of location focus on identifying the central point or specific positions within a dataset. The mean (arithmetic average) provides a measure of the central value, while the median indicates the middle value when data is ordered. The mode identifies the most frequently occurring value. These measures help in understanding the central tendency and comparing different datasets. Together, measures of dispersion and location offer a comprehensive view of the data's distribution, aiding in effective data analysis and interpretation.

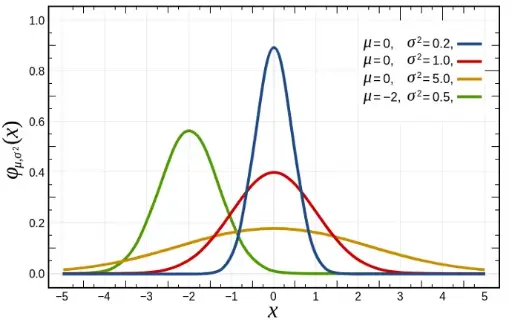
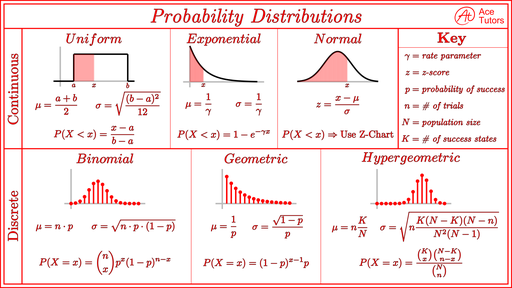
This online course offers an in-depth exploration of binomial, Poisson, and normal probability distributions, essential concepts in statistics and probability theory. Students will learn the characteristics and applications of each distribution, including scenarios where they are most appropriate. The course covers the binomial distribution's focus on binary outcomes, the Poisson distribution's relevance to event occurrence over time or space, and the normal distribution's bell-shaped curve describing continuous data. Through interactive lessons, practical examples, and real-world applications, participants will gain a solid understanding of these distributions and how to use them to analyze and interpret data effectively.

This online course provides an in-depth understanding of confidence intervals and sample size, essential concepts in statistical inference. Students will learn how to construct and interpret confidence intervals for population parameters, including the mean and proportion, and understand the role of confidence levels in determining interval width. The course will cover the relationship between sample size and the precision of estimates, and how to calculate the required sample size for a desired confidence level and margin of error. Through interactive lessons, practical examples, and real-world applications, participants will gain the skills to make informed decisions based on sample data, ensuring their findings are both accurate and reliable.

This online course provides a practical guide to solving descriptive statistics using Microsoft Excel, a powerful tool for data analysis. Students will learn to compute key descriptive statistics, such as mean, median, mode, standard deviation, and variance, using Excel functions. The course will cover data organization techniques, including sorting and filtering, and teach participants how to create and interpret visualizations like histograms, boxplots, and scatter plots. Through step-by-step tutorials and hands-on exercises, students will gain proficiency in using Excel to summarize and describe data effectively, enabling them to make informed decisions based on their analyses.

This online course provides a comprehensive introduction to hypothesis testing, a fundamental concept in statistical inference. Students will learn the principles and steps involved in formulating and testing hypotheses, including defining null and alternative hypotheses, selecting appropriate test statistics, and determining significance levels (p-values). The course will cover various types of hypothesis tests, such as t-tests, chi-square tests, and ANOVA, along with their applications. Through interactive lessons, real-world examples, and hands-on exercises, participants will gain the skills to conduct hypothesis tests, interpret results, and make data-driven decisions with confidence.

In this module, we explore the concepts of correlation and regression analysis, essential tools for understanding and modeling the relationships between variables. The lesson begins with an introduction to correlation, explaining how it measures the strength and direction of the linear relationship between two variables. We then delve into regression analysis, which allows us to predict the value of one variable based on the value of another. You'll learn about the assumptions underlying regression, how to interpret regression coefficients, and how to assess the goodness of fit. Practical examples and applications are provided to solidify your understanding, concluding with a summary of key concepts and techniques.

In this module, we delve into Analysis of Variance (ANOVA), a statistical method used to compare the means of three or more groups to determine if there are any statistically significant differences between them. The session covers the fundamental concepts of ANOVA, including its purpose and application in hypothesis testing. We explore the key components of the ANOVA model, such as between-group and within-group variability, and discuss the assumptions required for valid results. The module includes practical examples to illustrate the use of ANOVA in various research scenarios and concludes with a summary of the key techniques and interpretations.