Measures of Central Tendencies
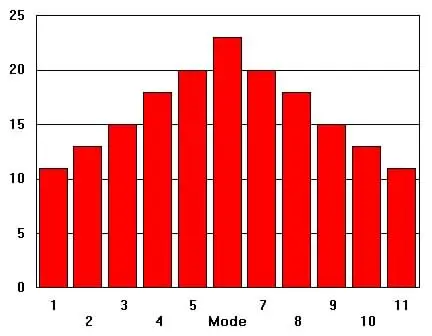
The presentation starts with an introduction to the concept of central tendencies in statistics, which are measures used to determine the center or typical value of a dataset. It begins by discussing the mean, explaining how it is calculated by summing all data points and dividing by the number of points. The median is then covered, defined as the middle value when the data is ordered from smallest to largest, and its significance in representing the central value in skewed distributions is highlighted. The mode, which is the most frequently occurring value in a dataset, is also explained, along with its use in identifying the most common data points. The presentation includes examples and visual aids to illustrate each measure, their calculation, and their appropriate applications. Finally, a comparison of these measures is provided, discussing their strengths and weaknesses, and offering guidance on choosing the right measure based on the nature of the data and the analysis objectives.